Widgets
Modular panels that can be combined into workspaces for analysis and visualization of neural circuits.
Basic Widgets
For public, static datasets — freely available.
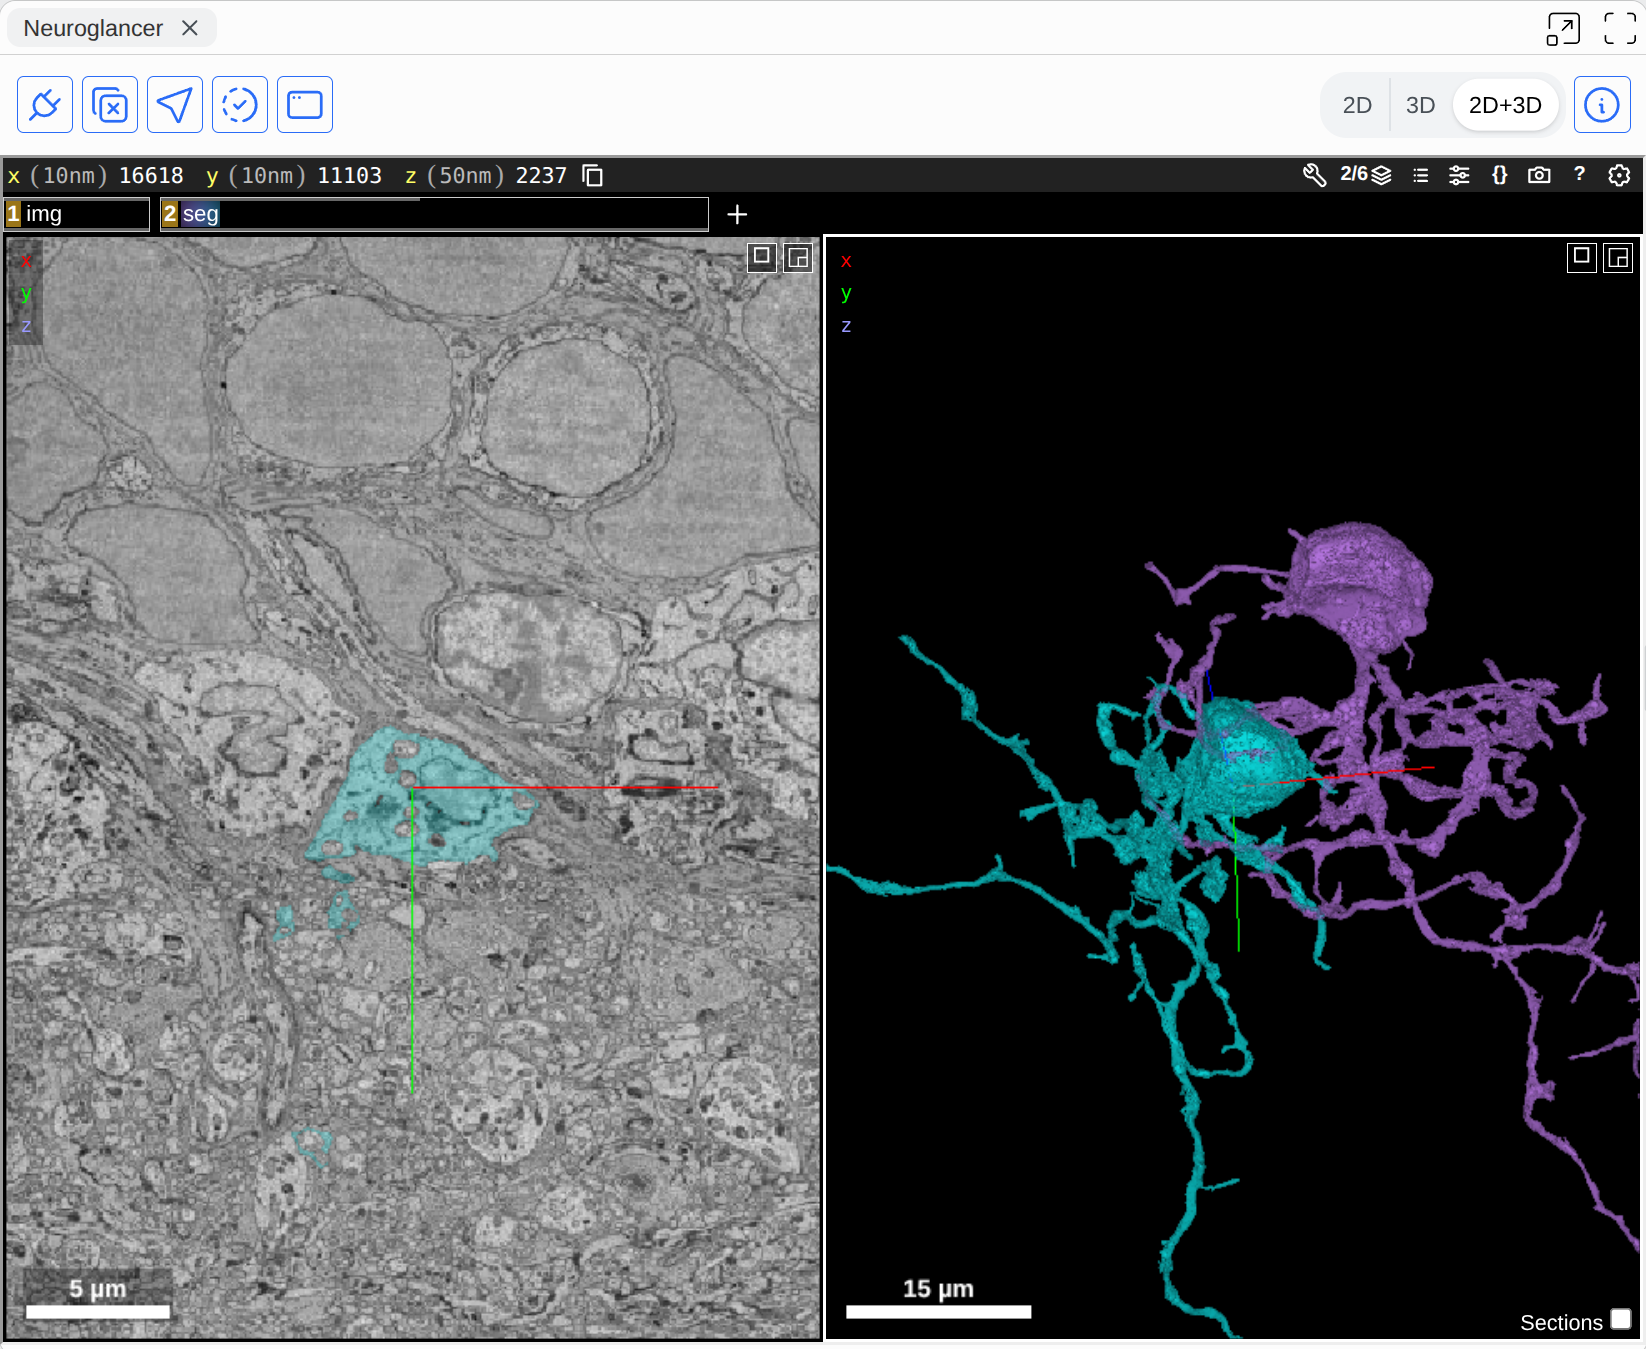
Neuroglancer 3D Viewer
Full-featured Neuroglancer integration for 3D connectome exploration.
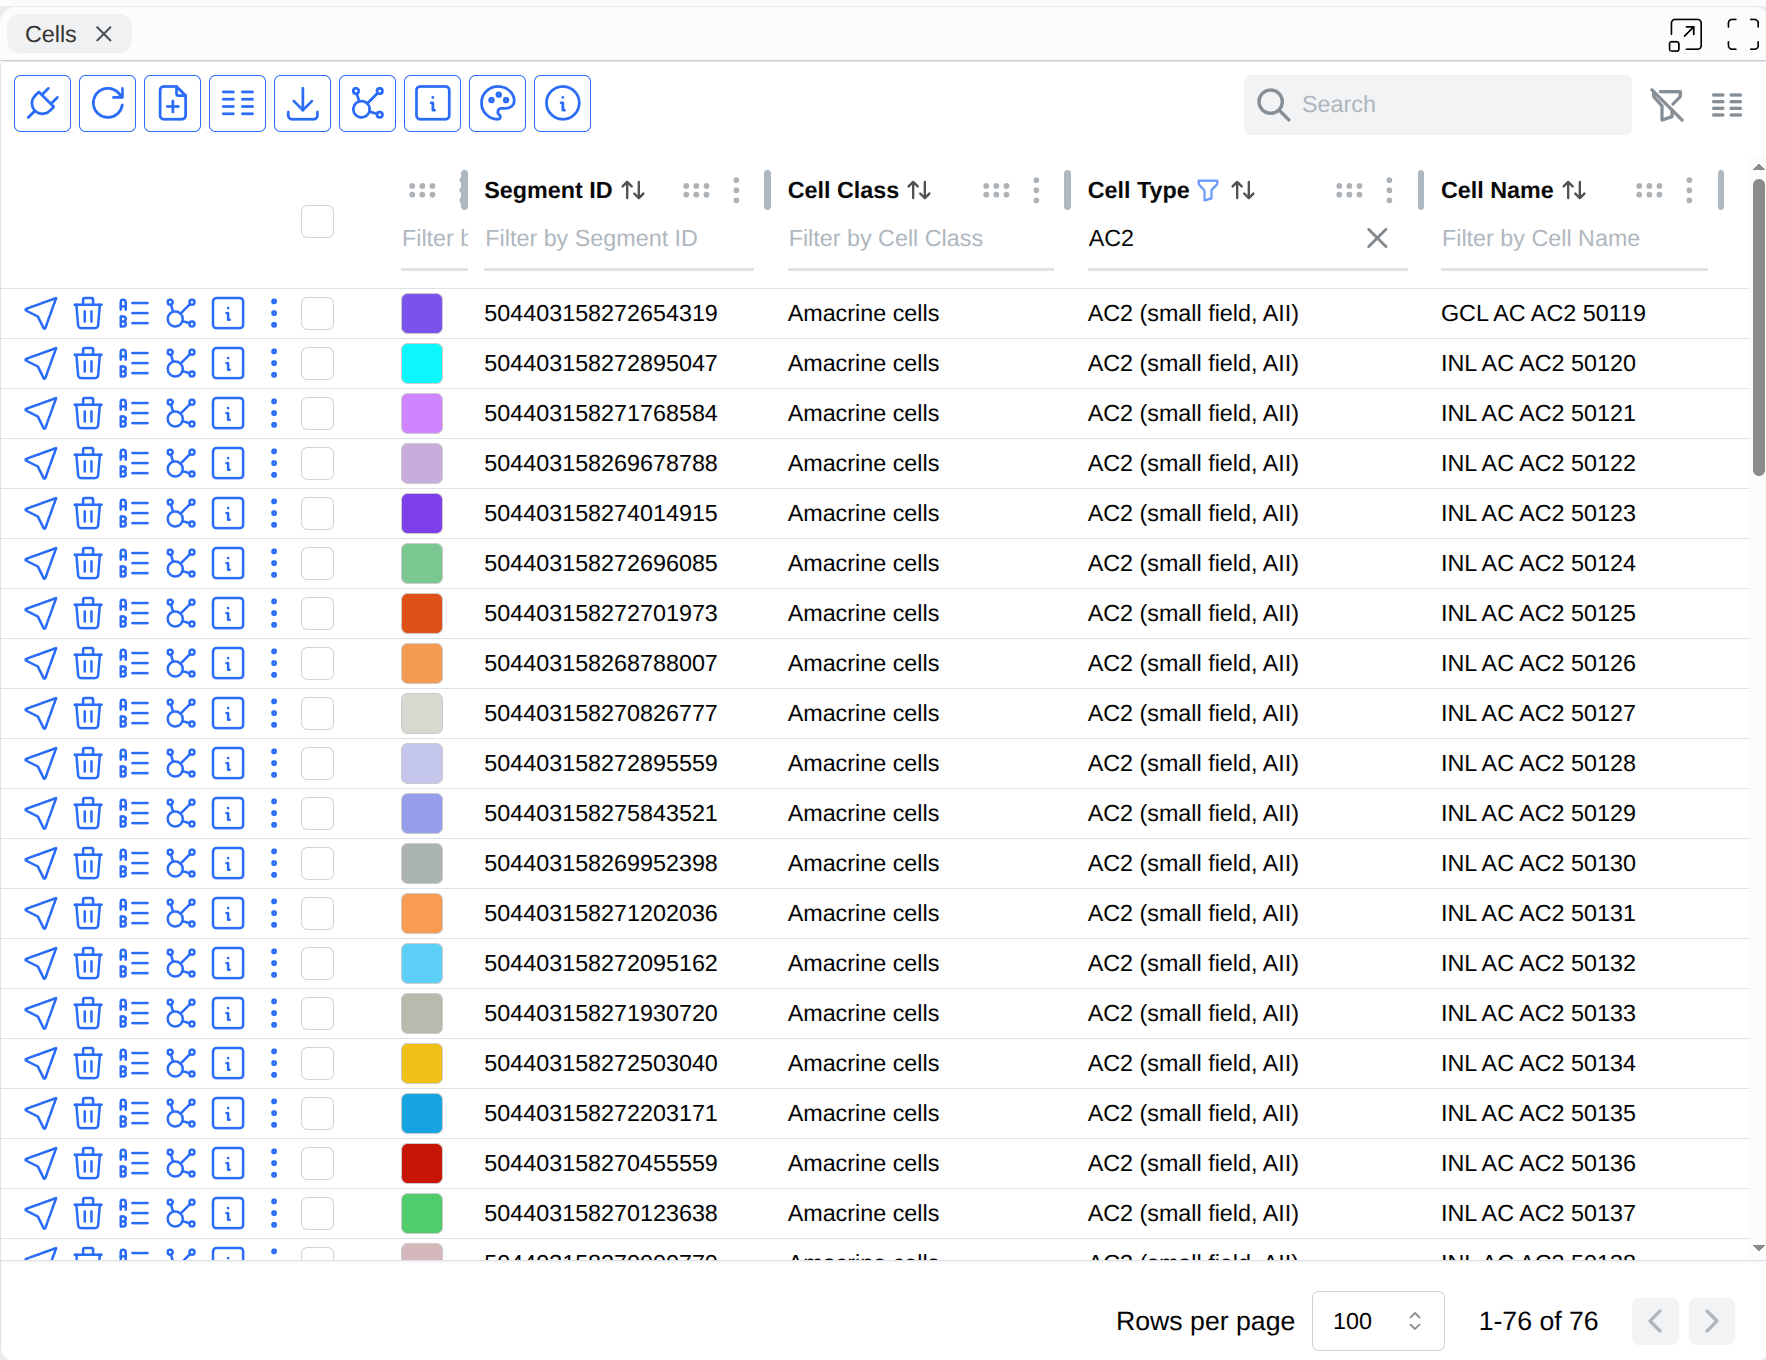
Cells Table
Browse, filter, and edit the full cell annotation table.
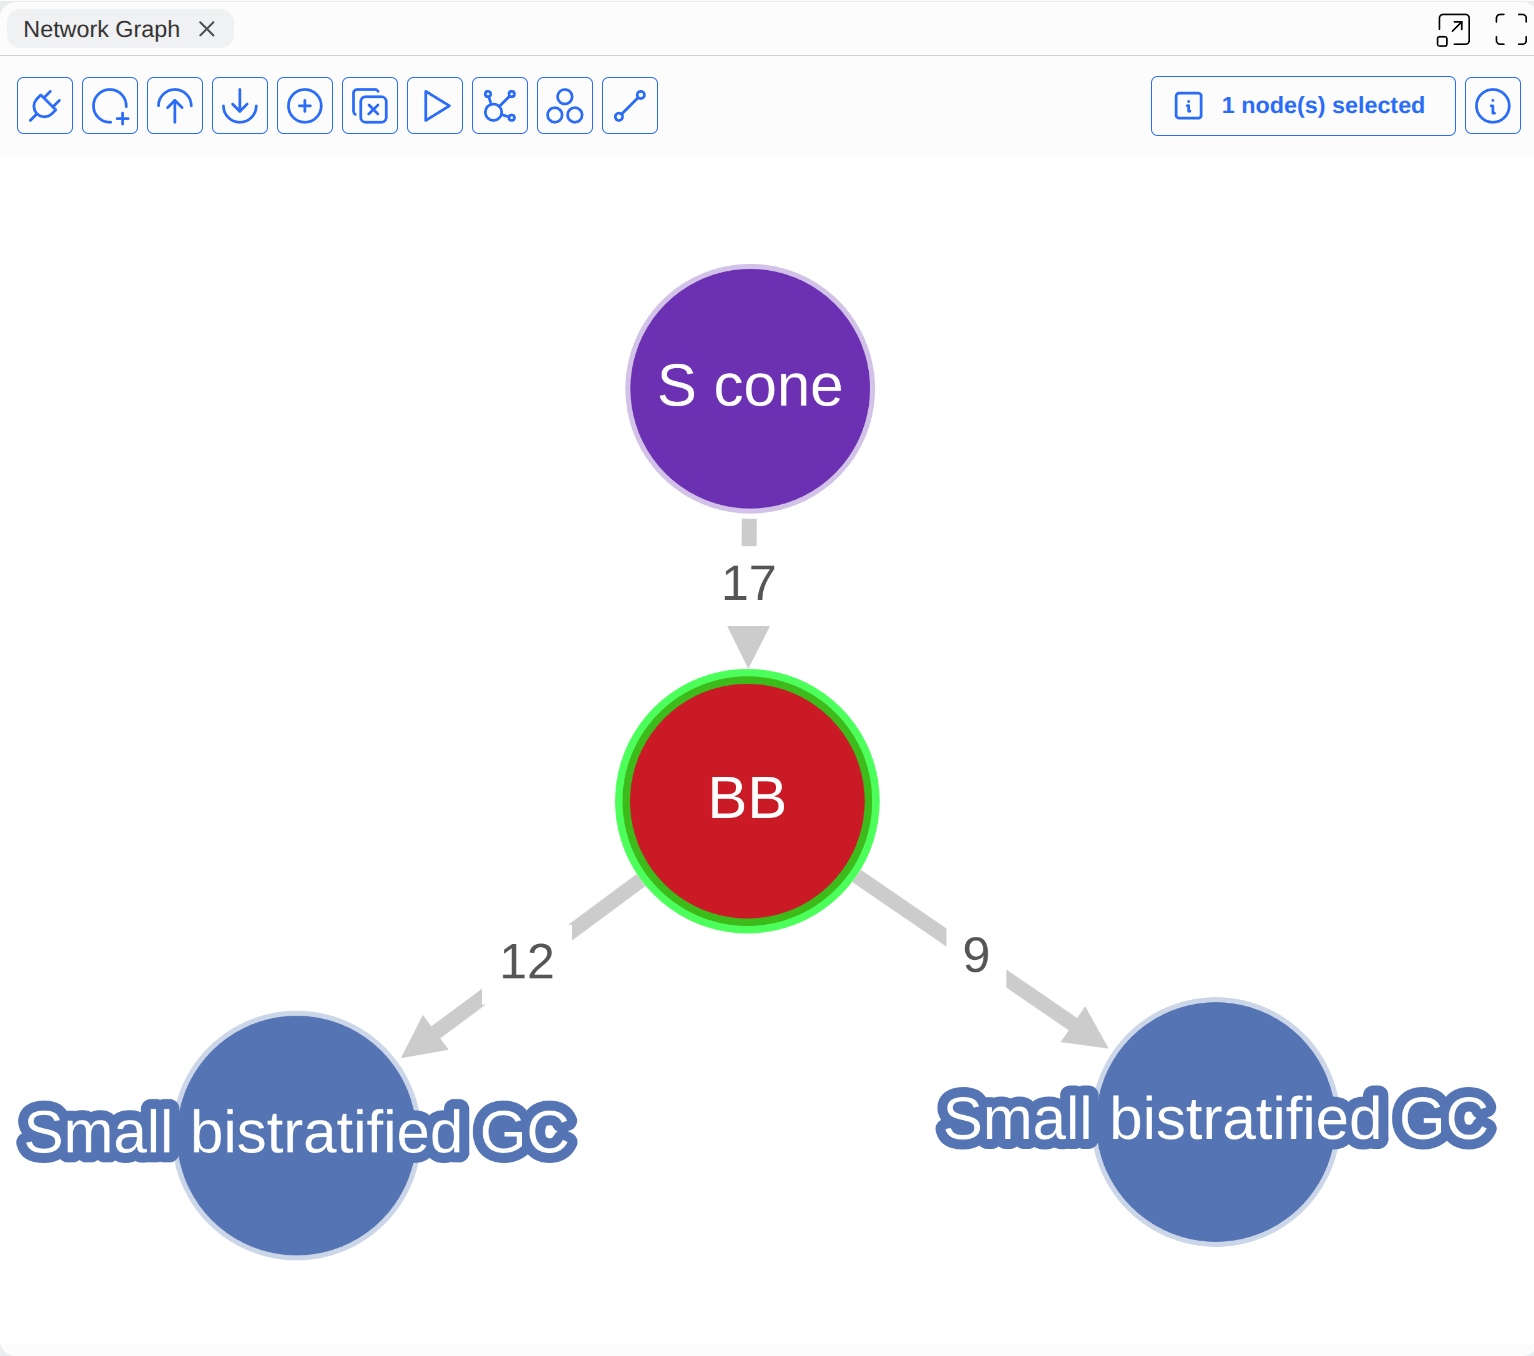
Cell Network Graph
Interactive Cytoscape.js graph of cell connectivity.
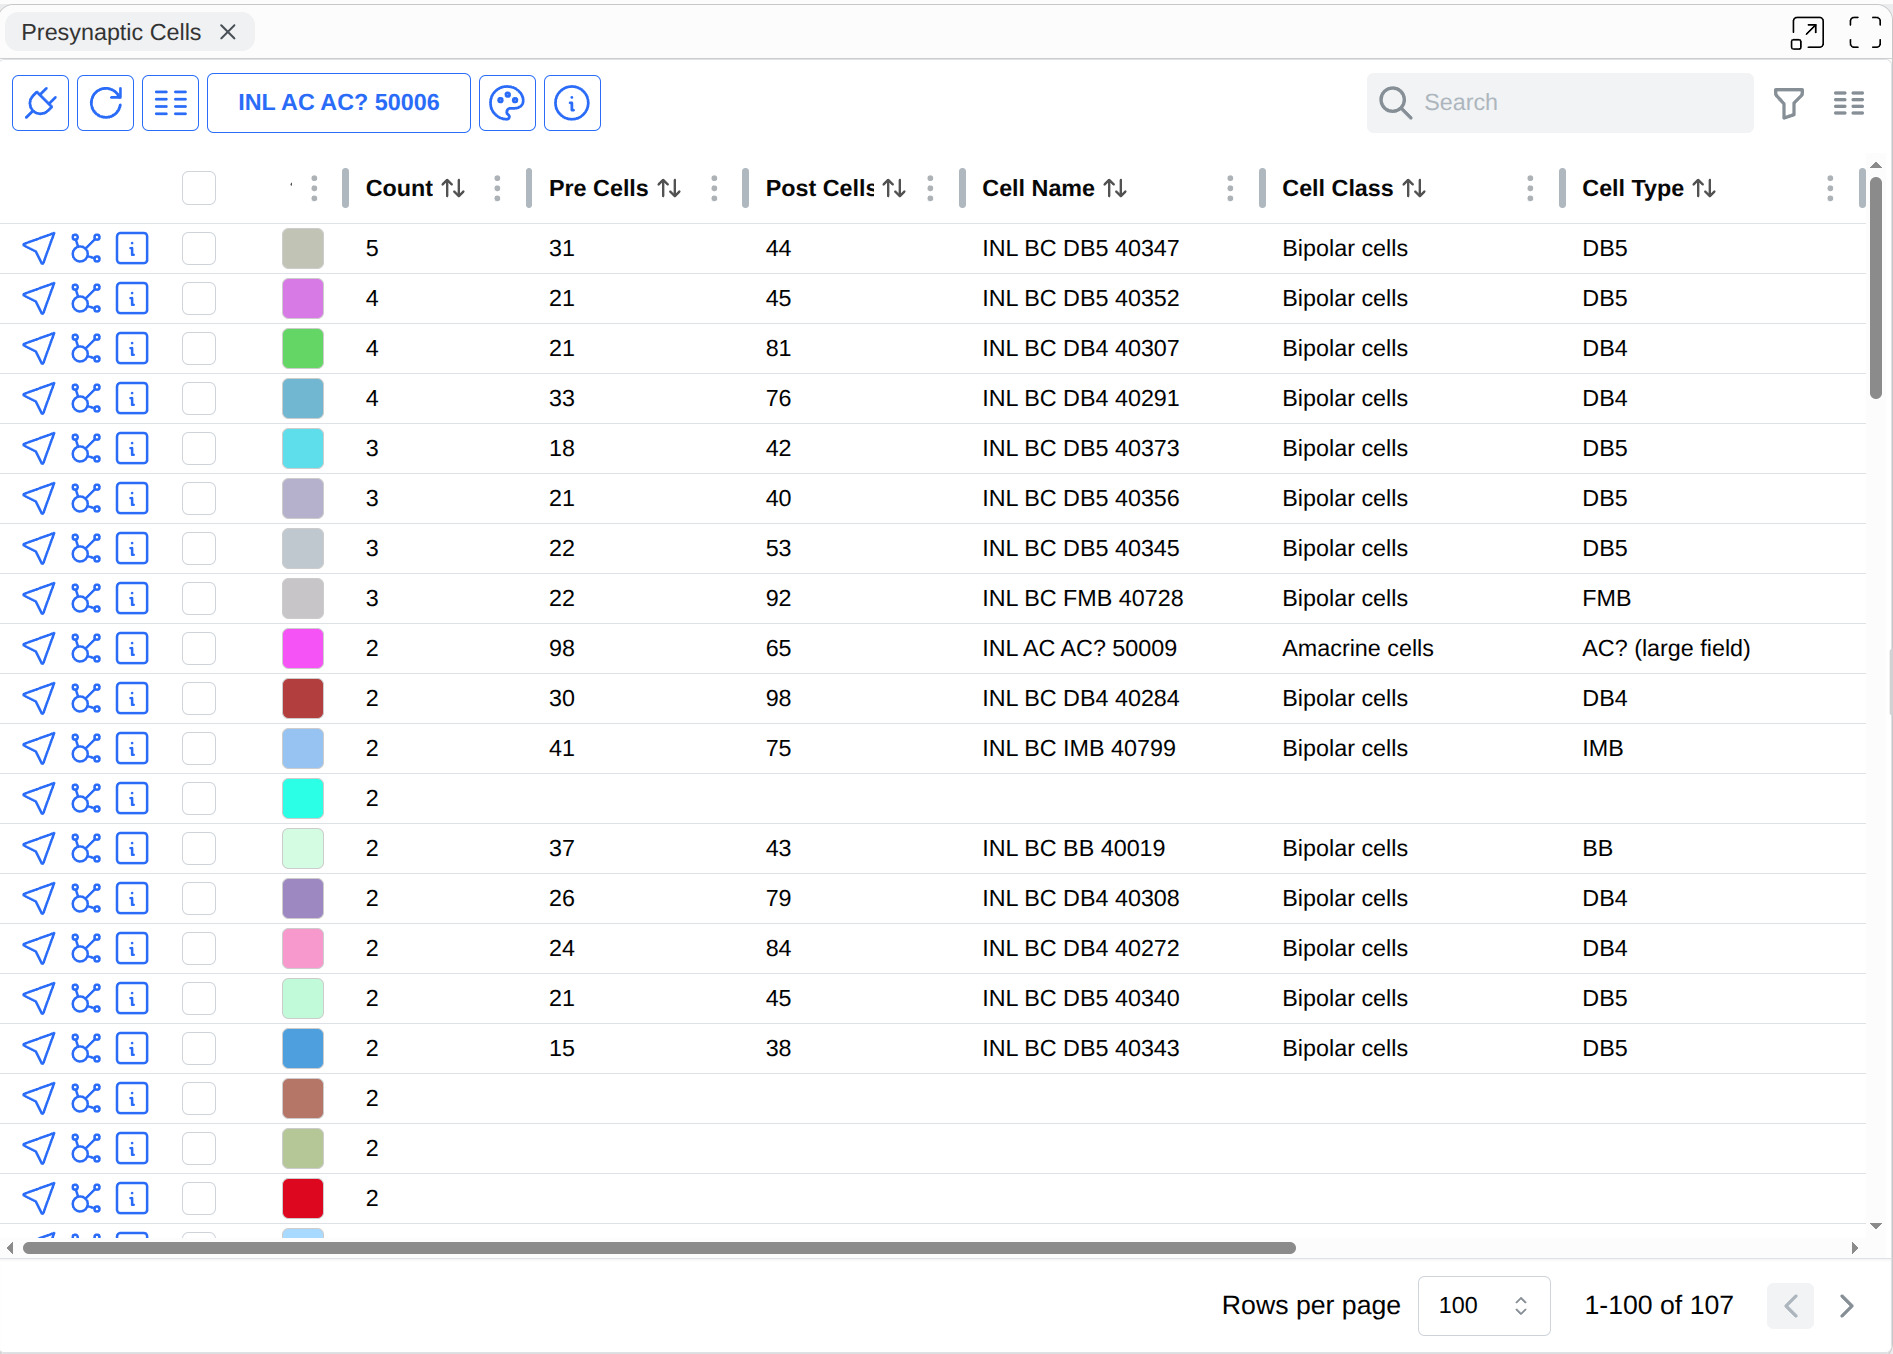
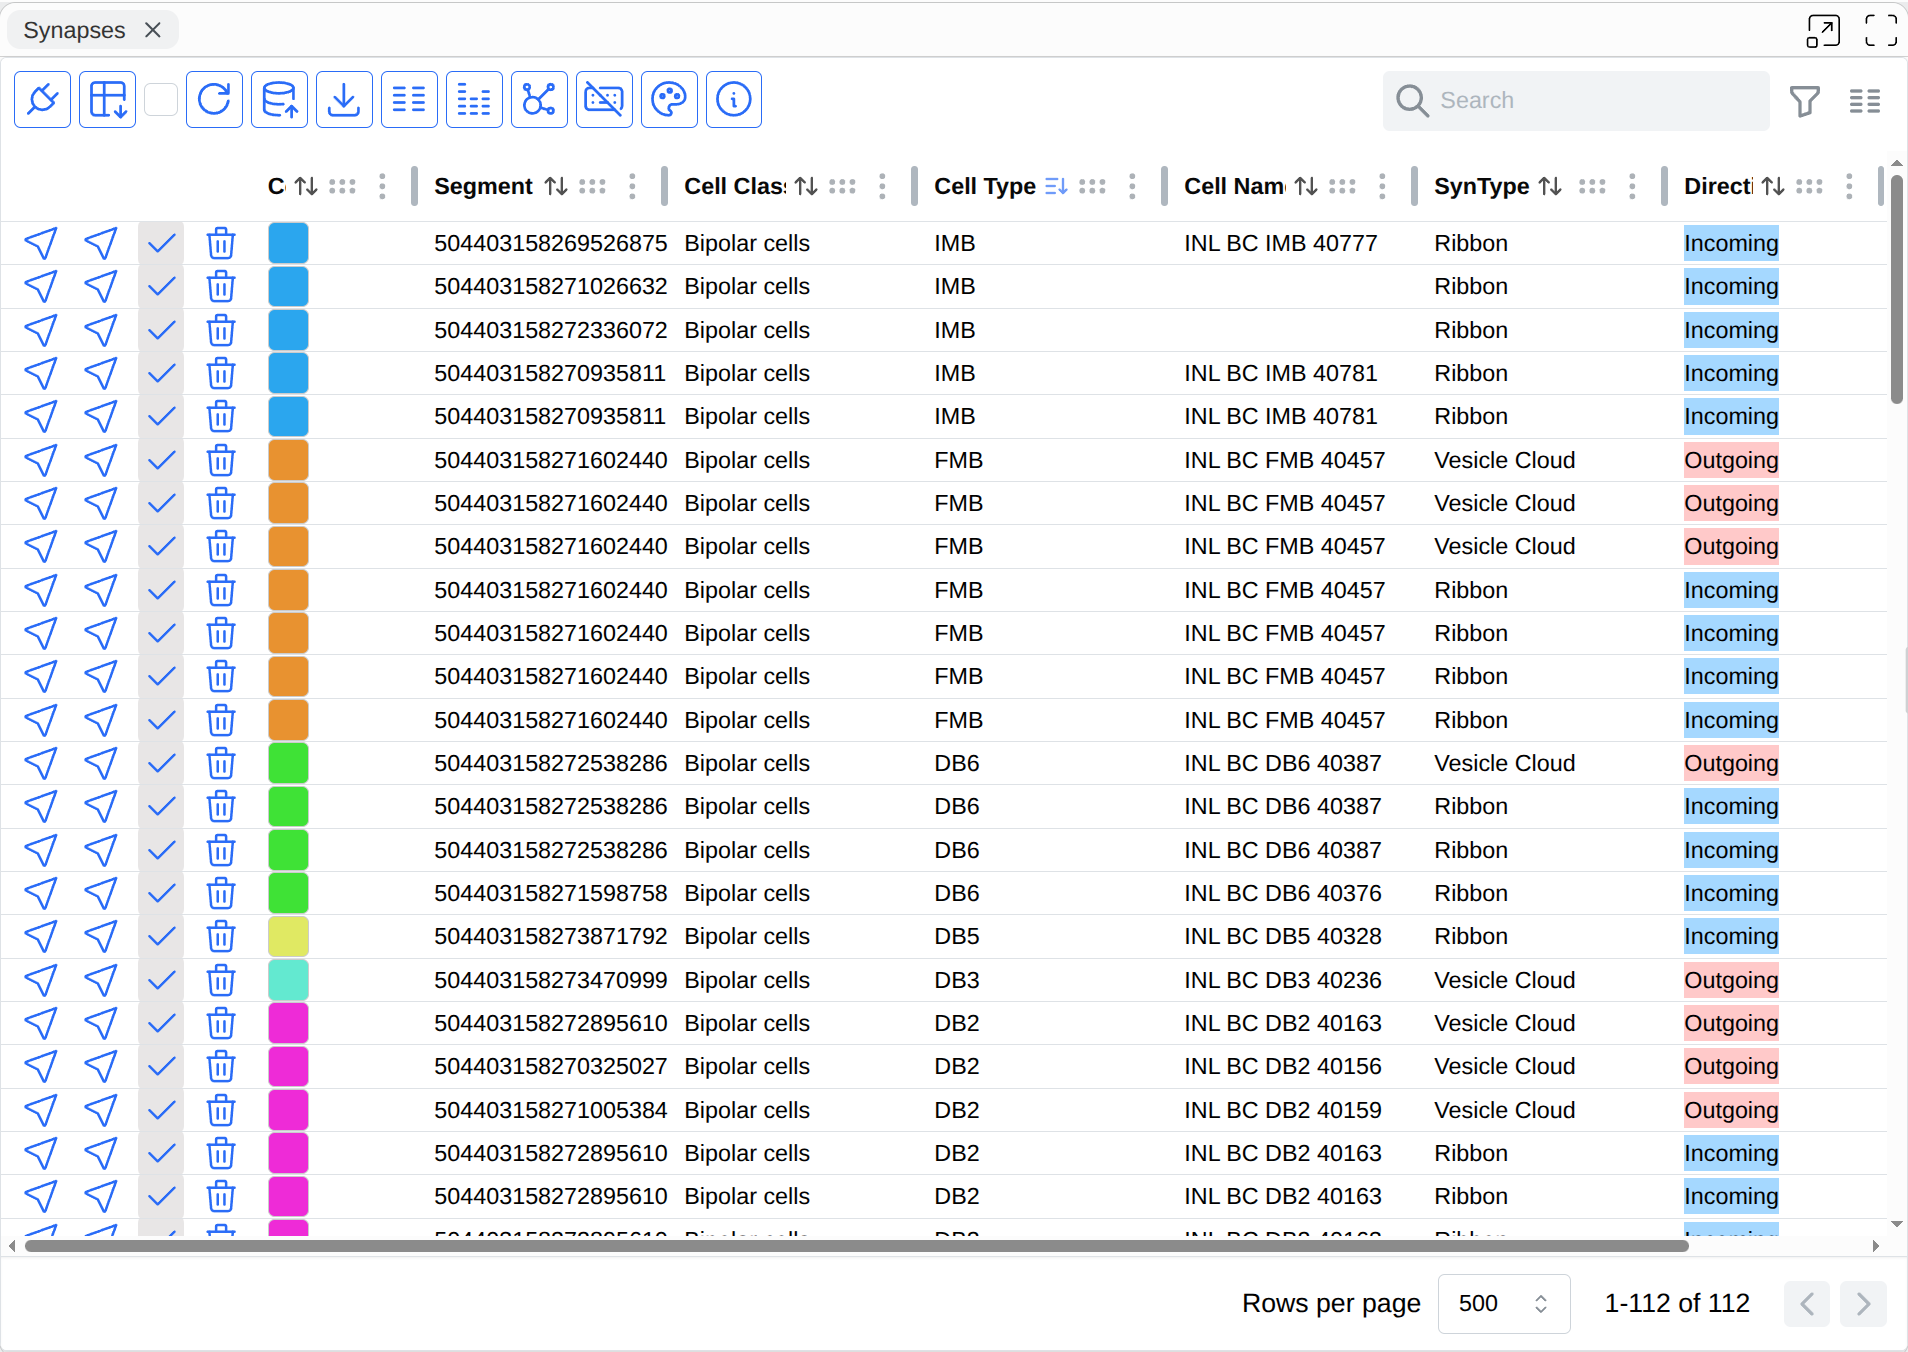
Cell Connections Table
Tabular view of upstream/downstream synaptic partners and counts.
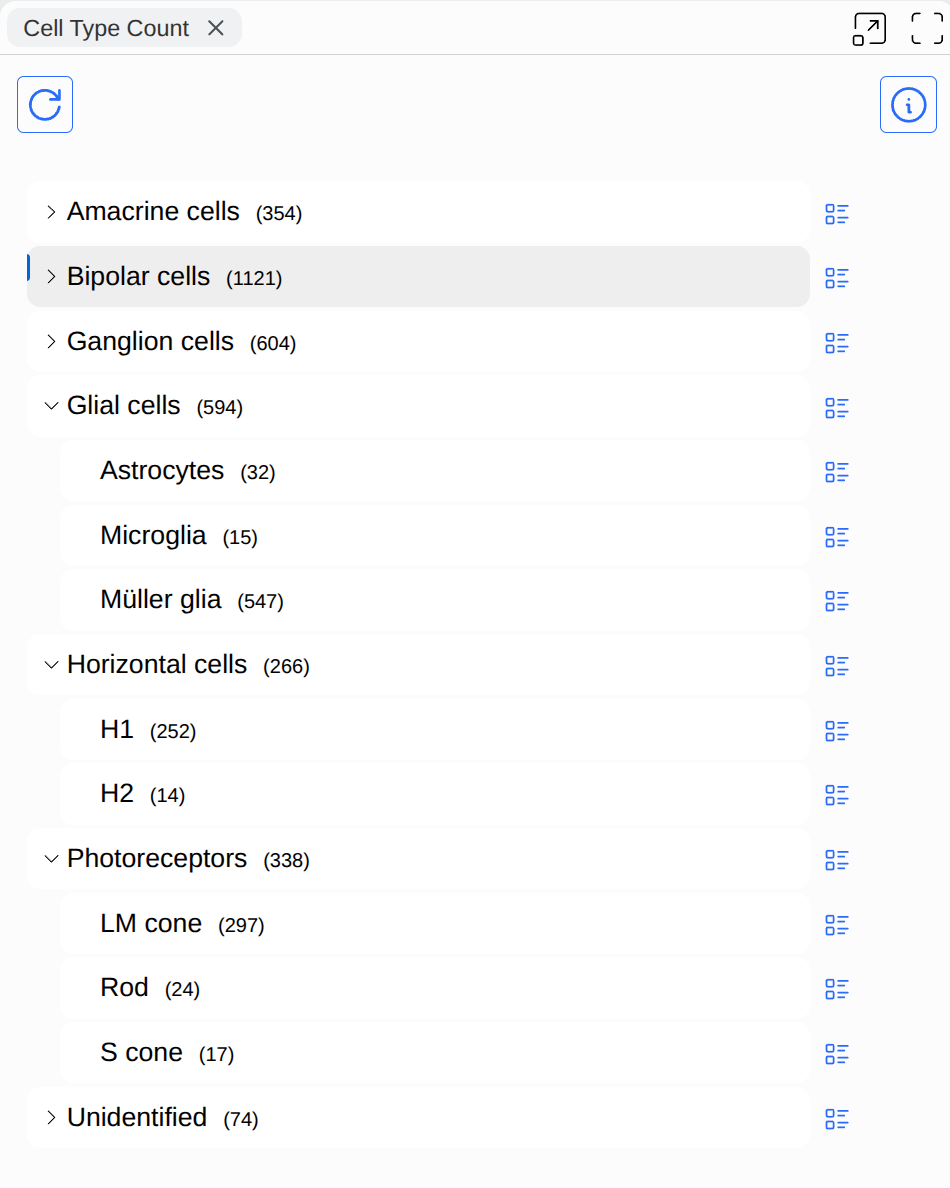
Tree Widget
Hierarchical tree view of cell types with counts.
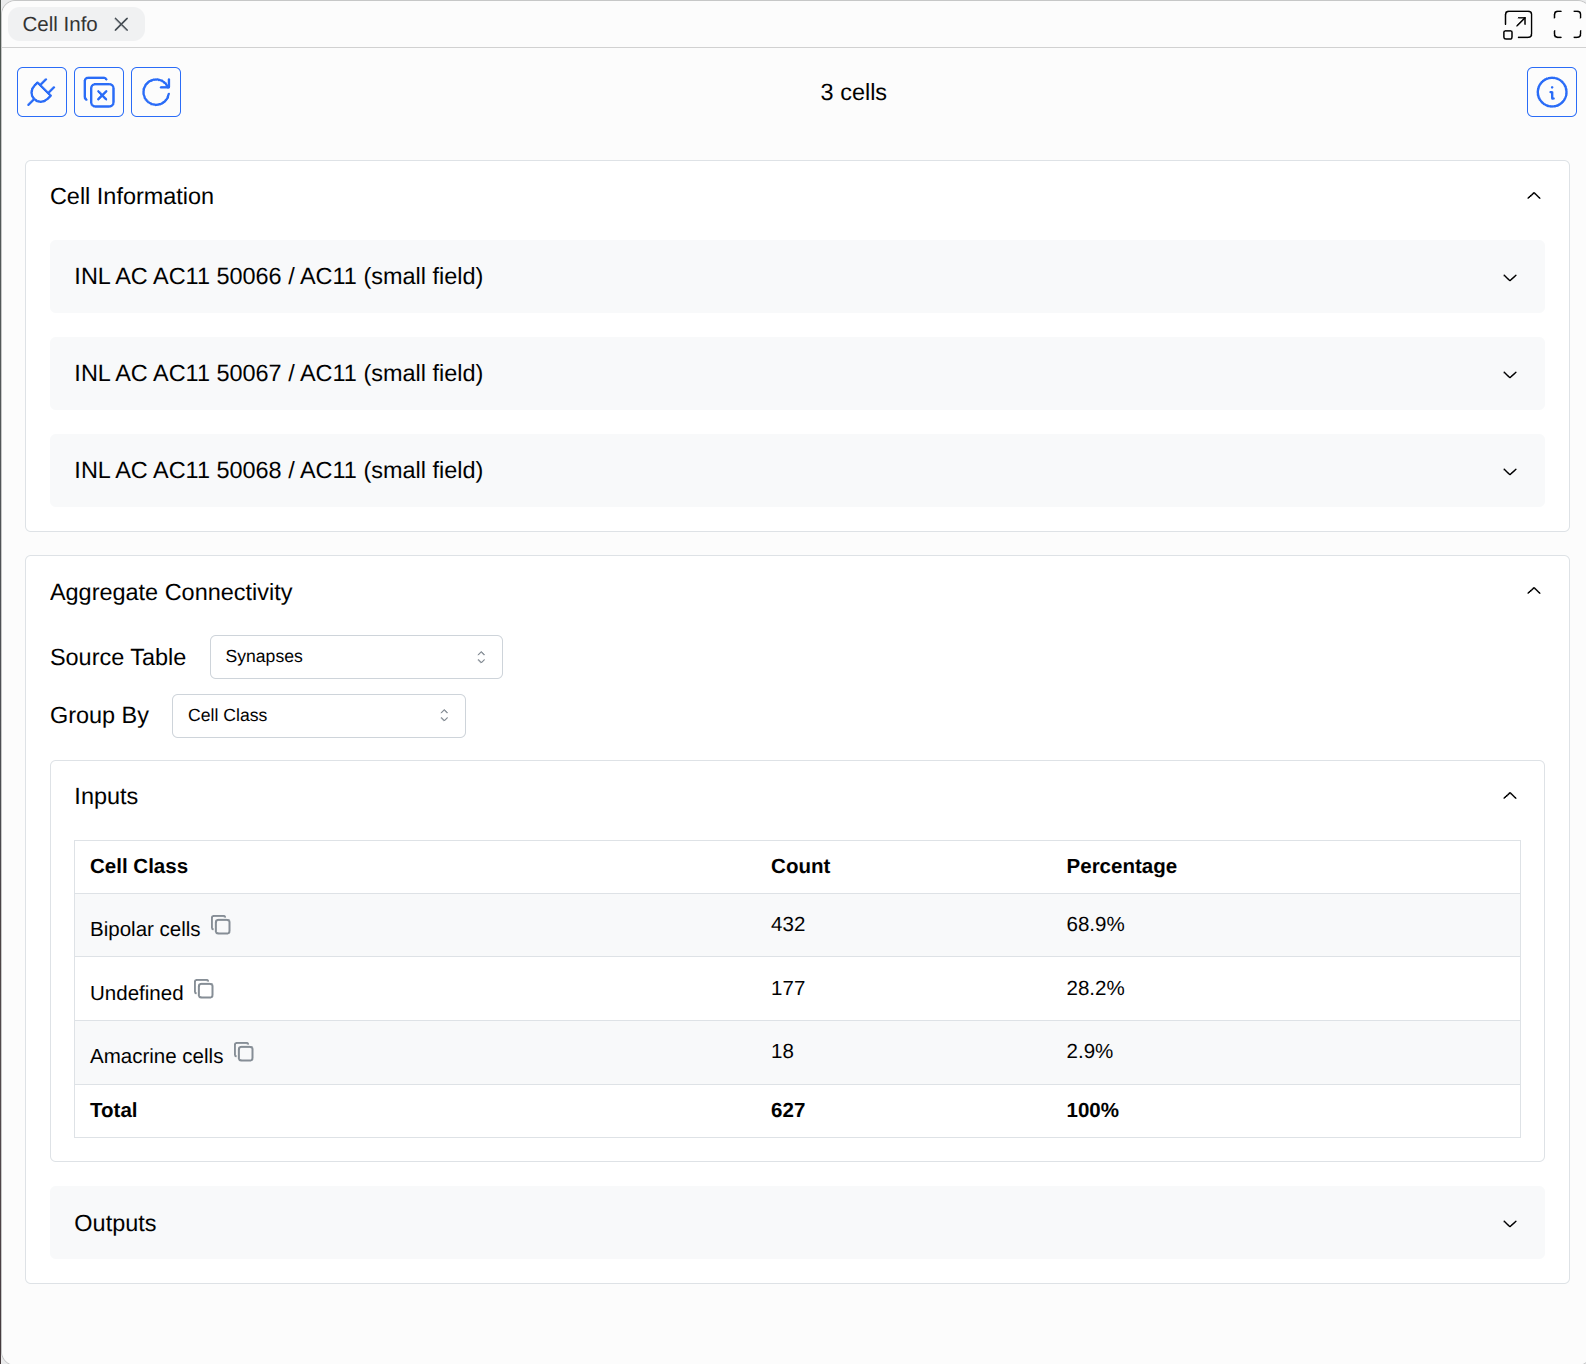
Cell Info Widget
Aggregate connectivity information for set of cells.
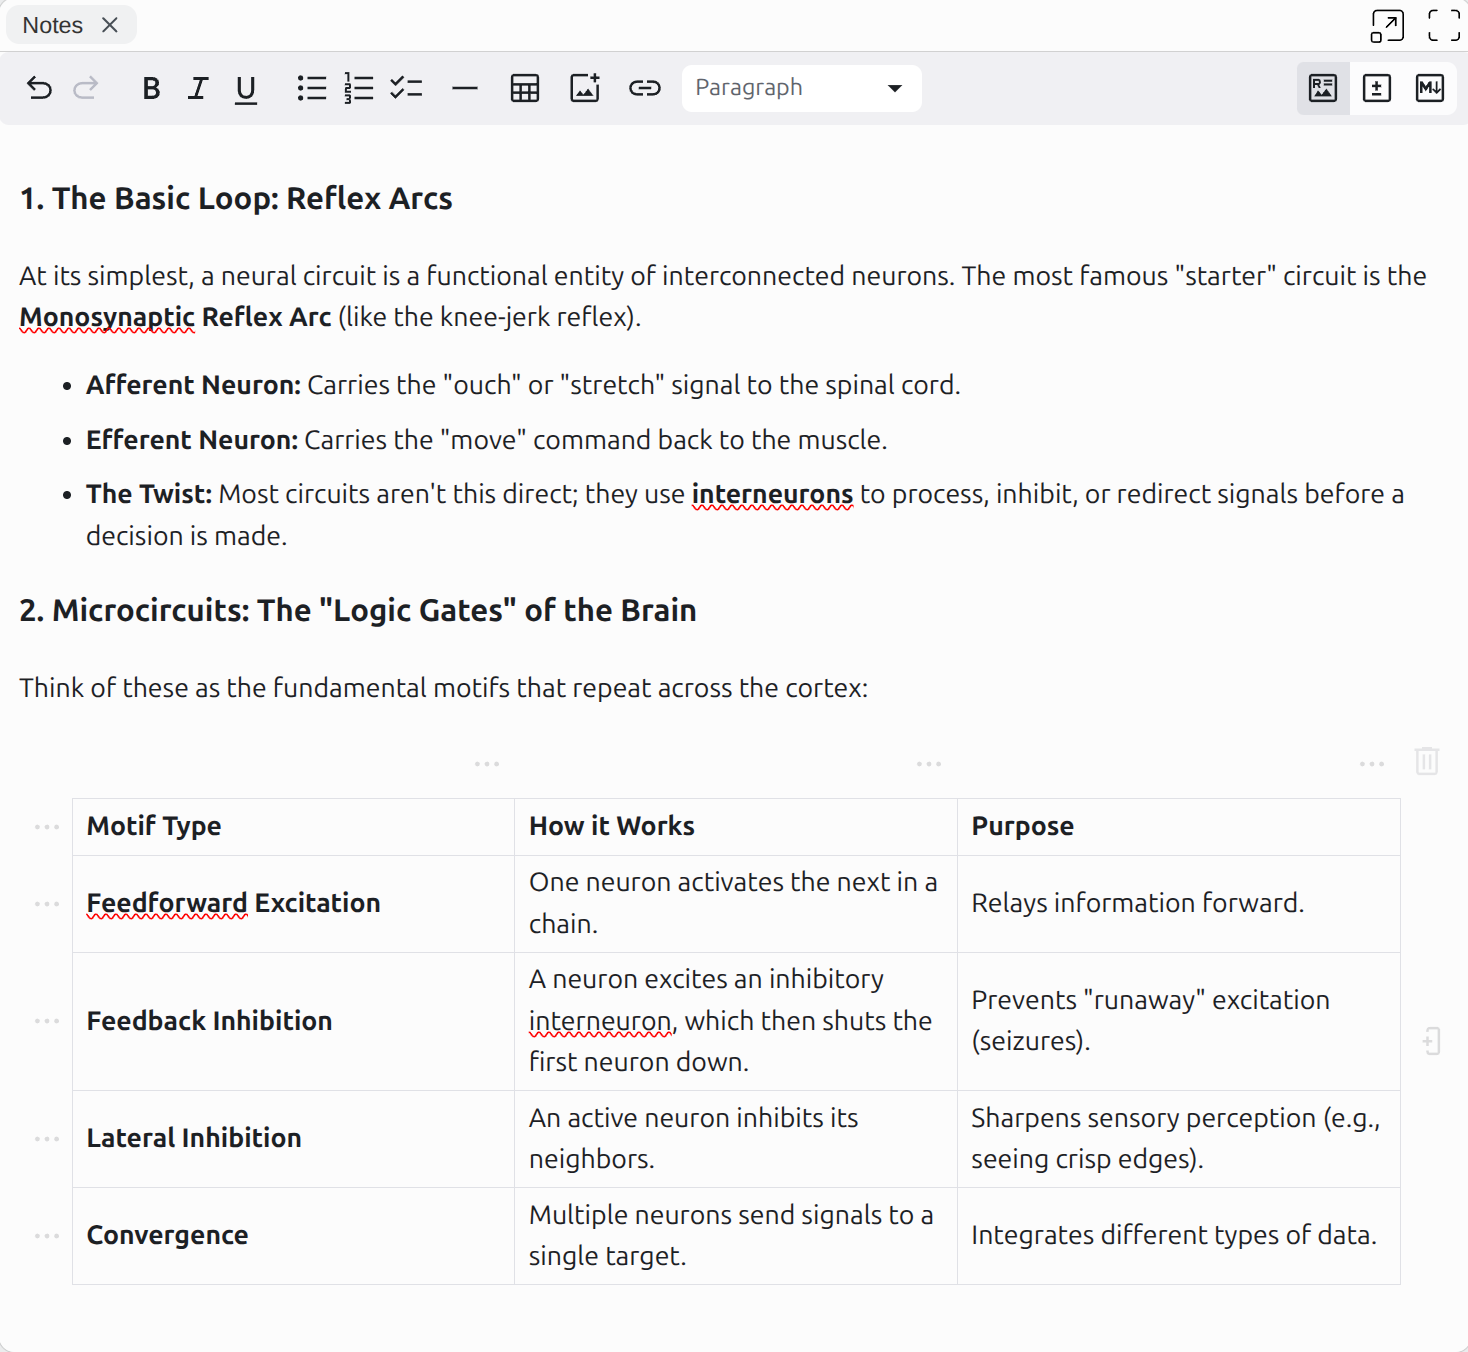
Notes
Freeform markdown notes saved with the workspace.
Professional & Community Widgets
Usable with a Professional Subscription or in Community Proofreading Datasets.
Cell Annotations
Create and manage point/line annotations with Neuroglancer integration.
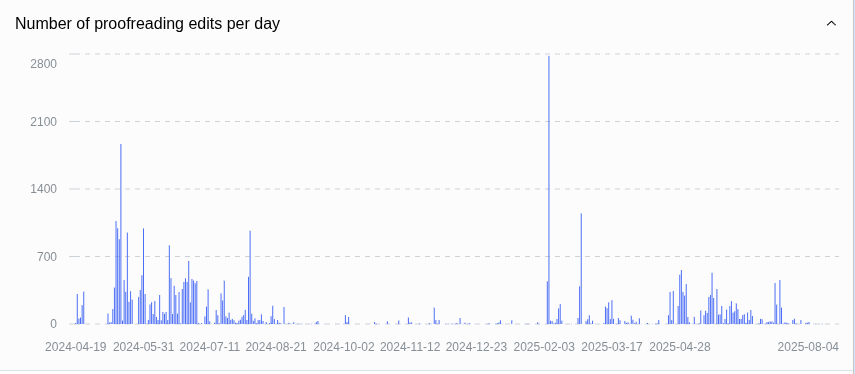
Progress Statistics
Bar charts of daily proofreading edit activity.
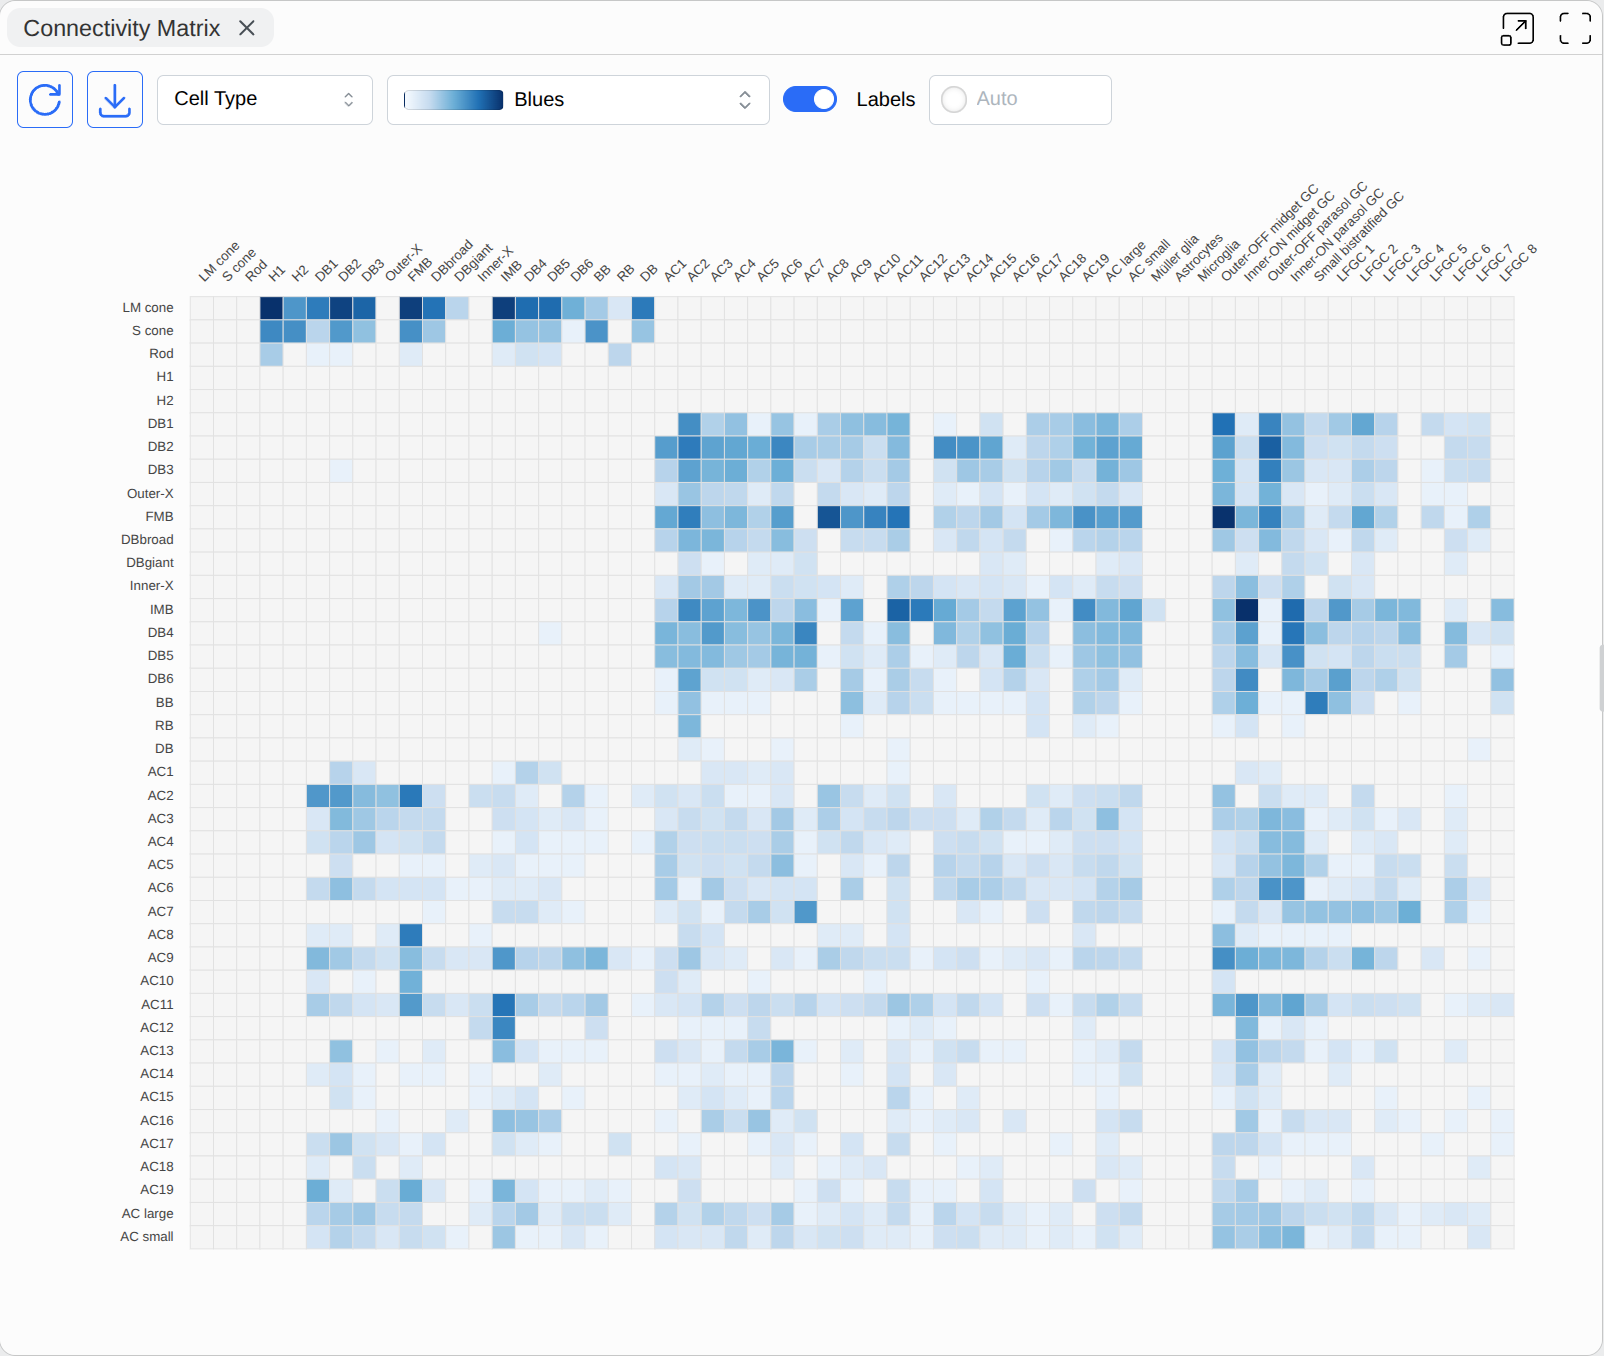
Connectivity Matrix
Color-coded synapse count matrix between cell types or classes.
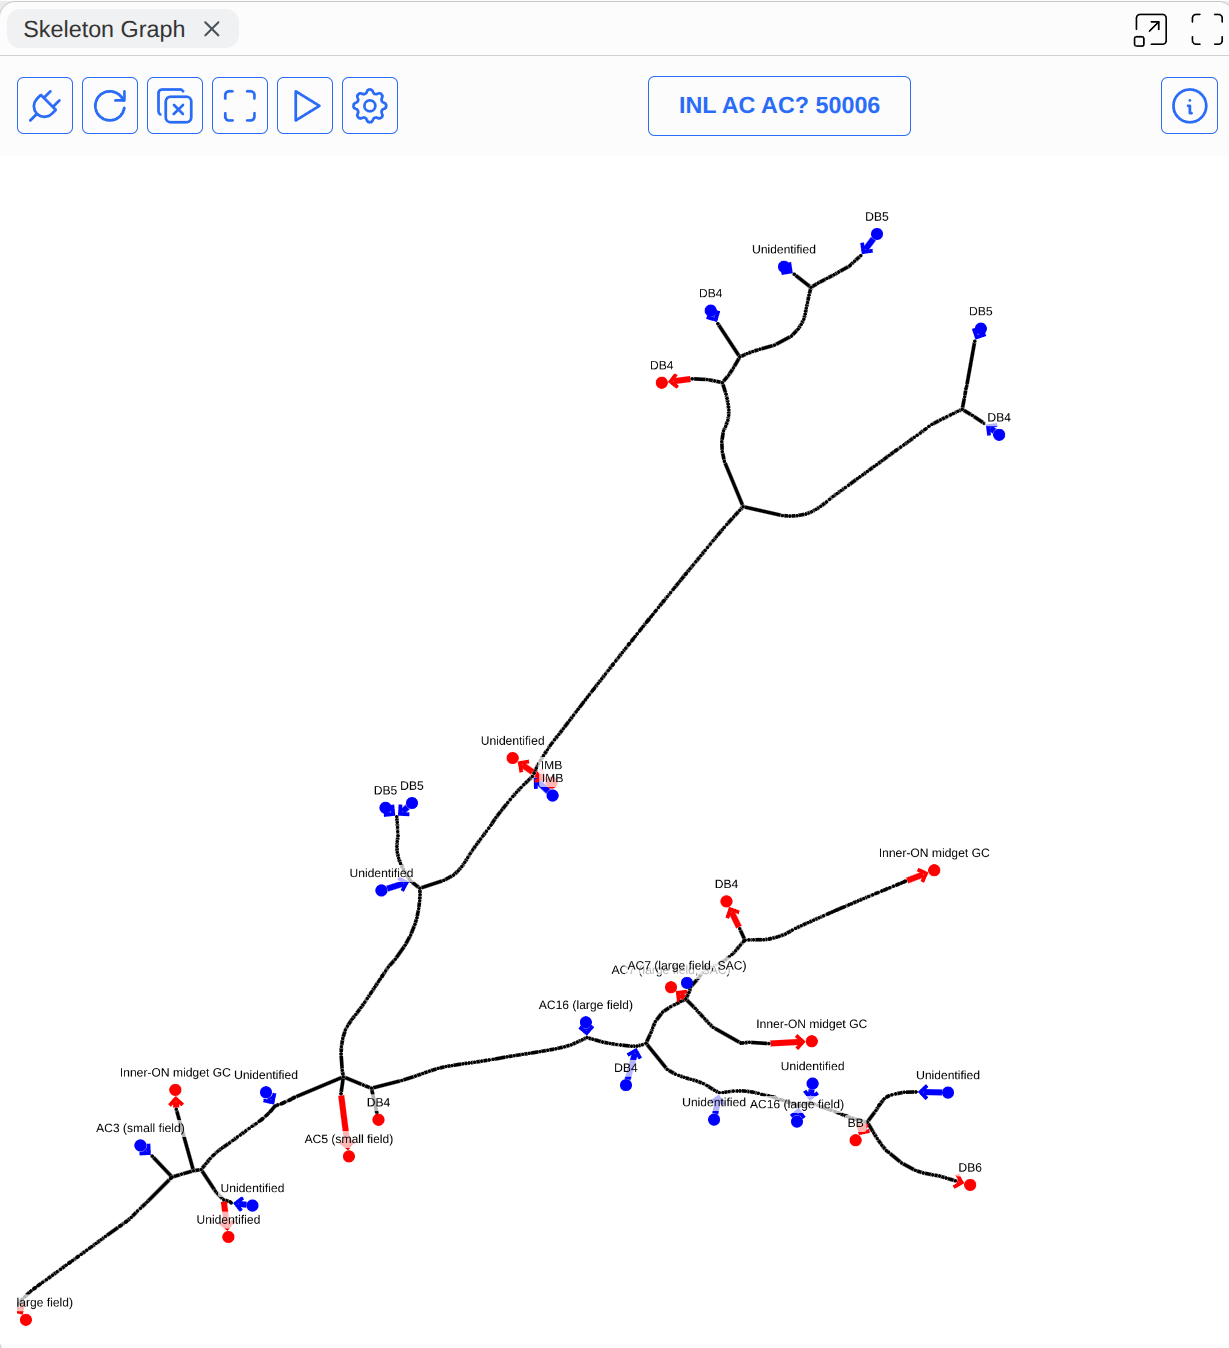
Skeleton Graph
Skeleton-based 2D projection of a neuron morphology with synapses.
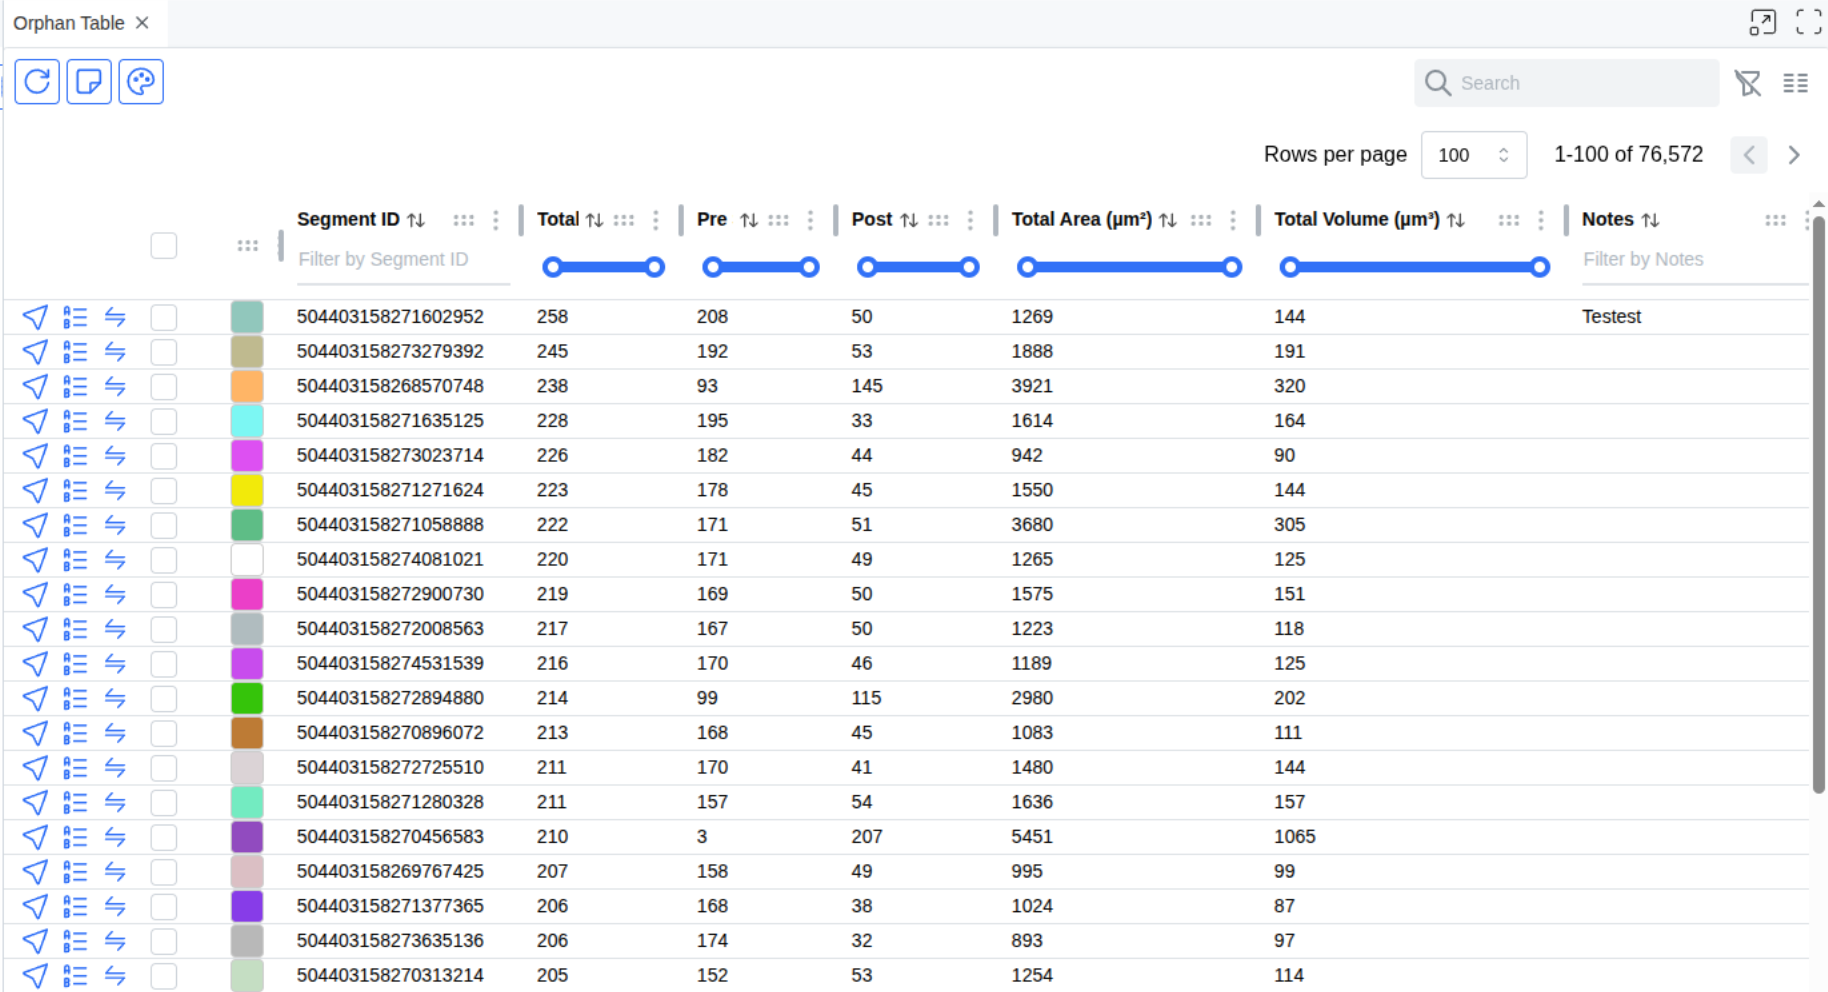
Orphan Table
Table of unidentified segments with synapses but no cell assignment.
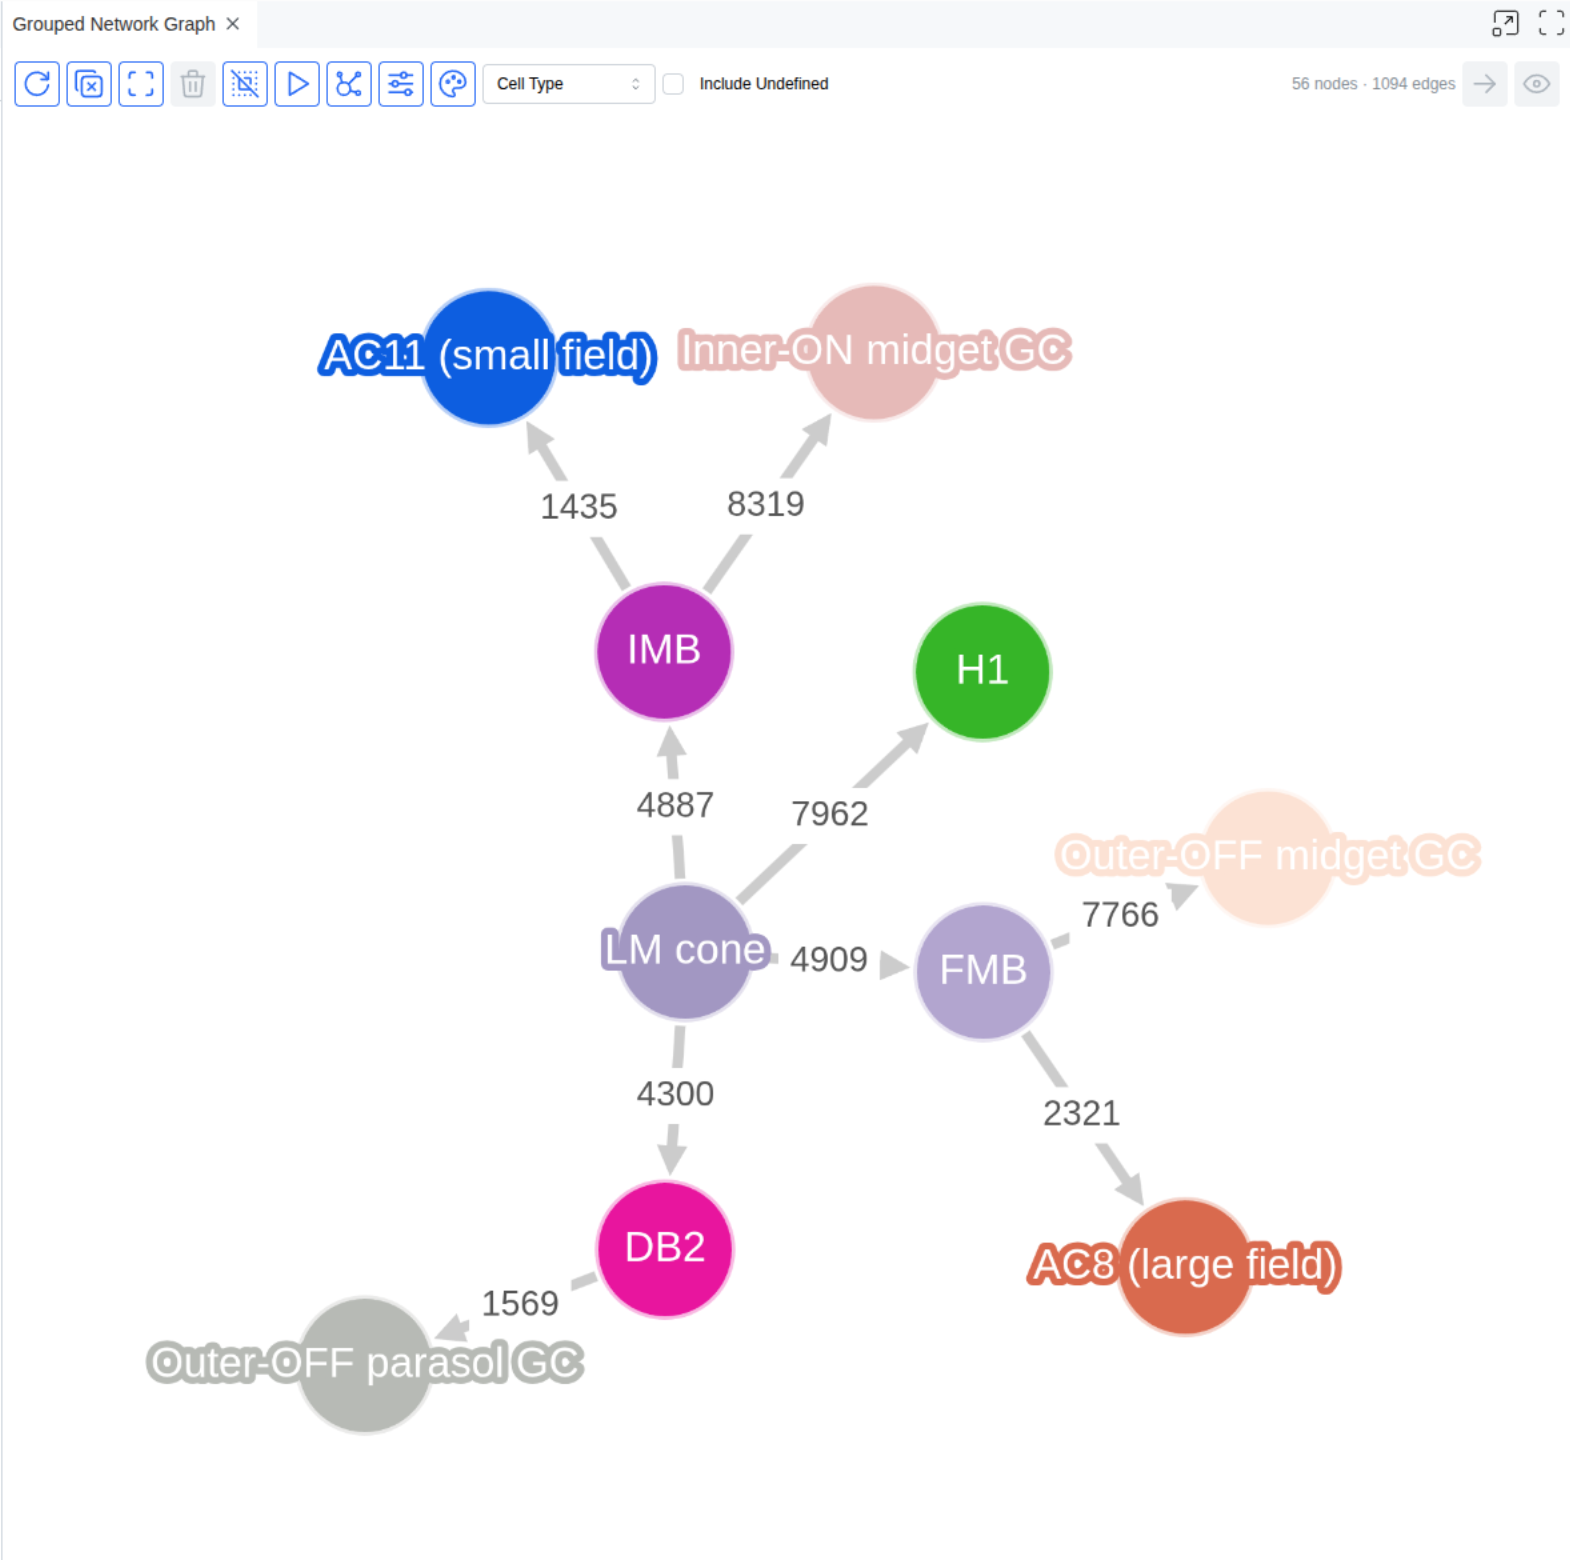
Grouped Network Graph
Aggregate connectivity graph grouped by cell type or class.
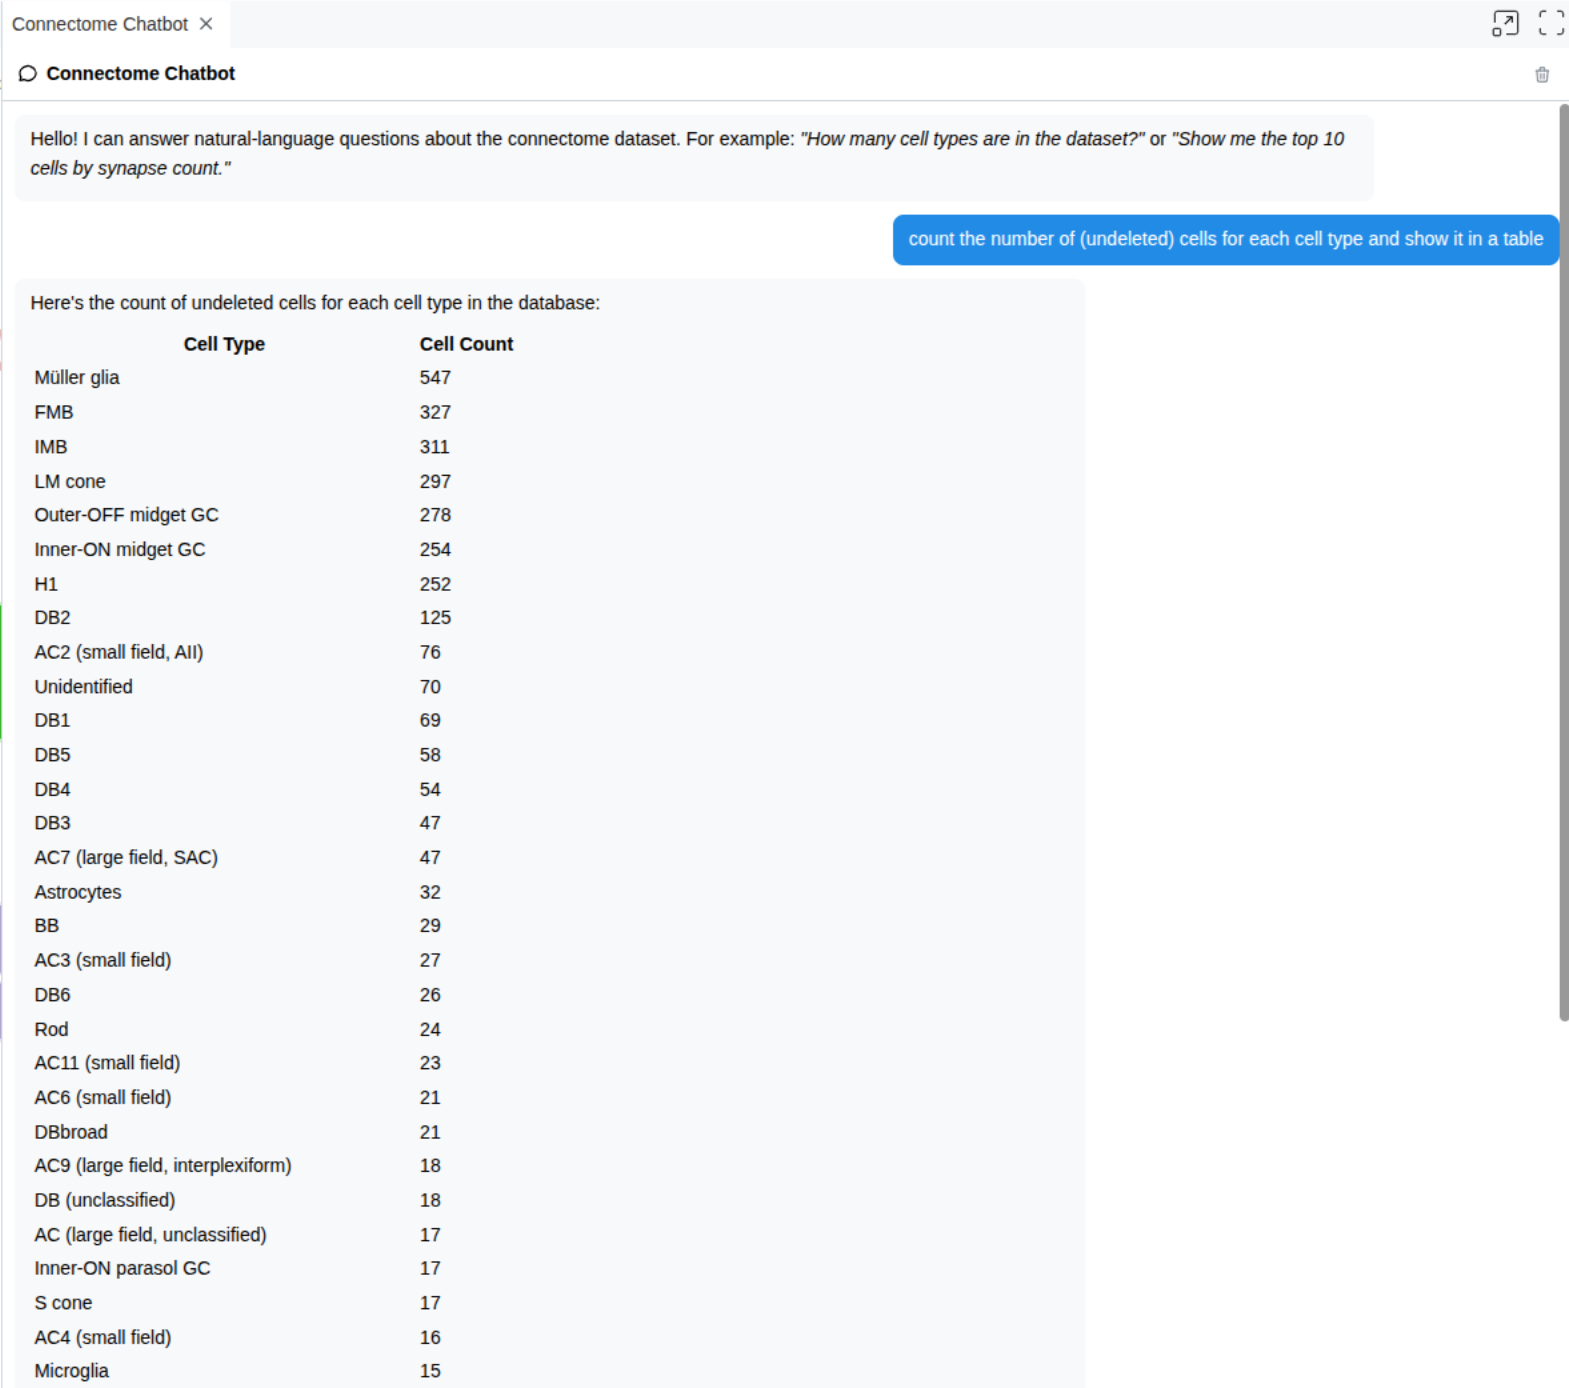
Connectome Chatbot
AI chatbot for querying the connectome dataset in natural language.
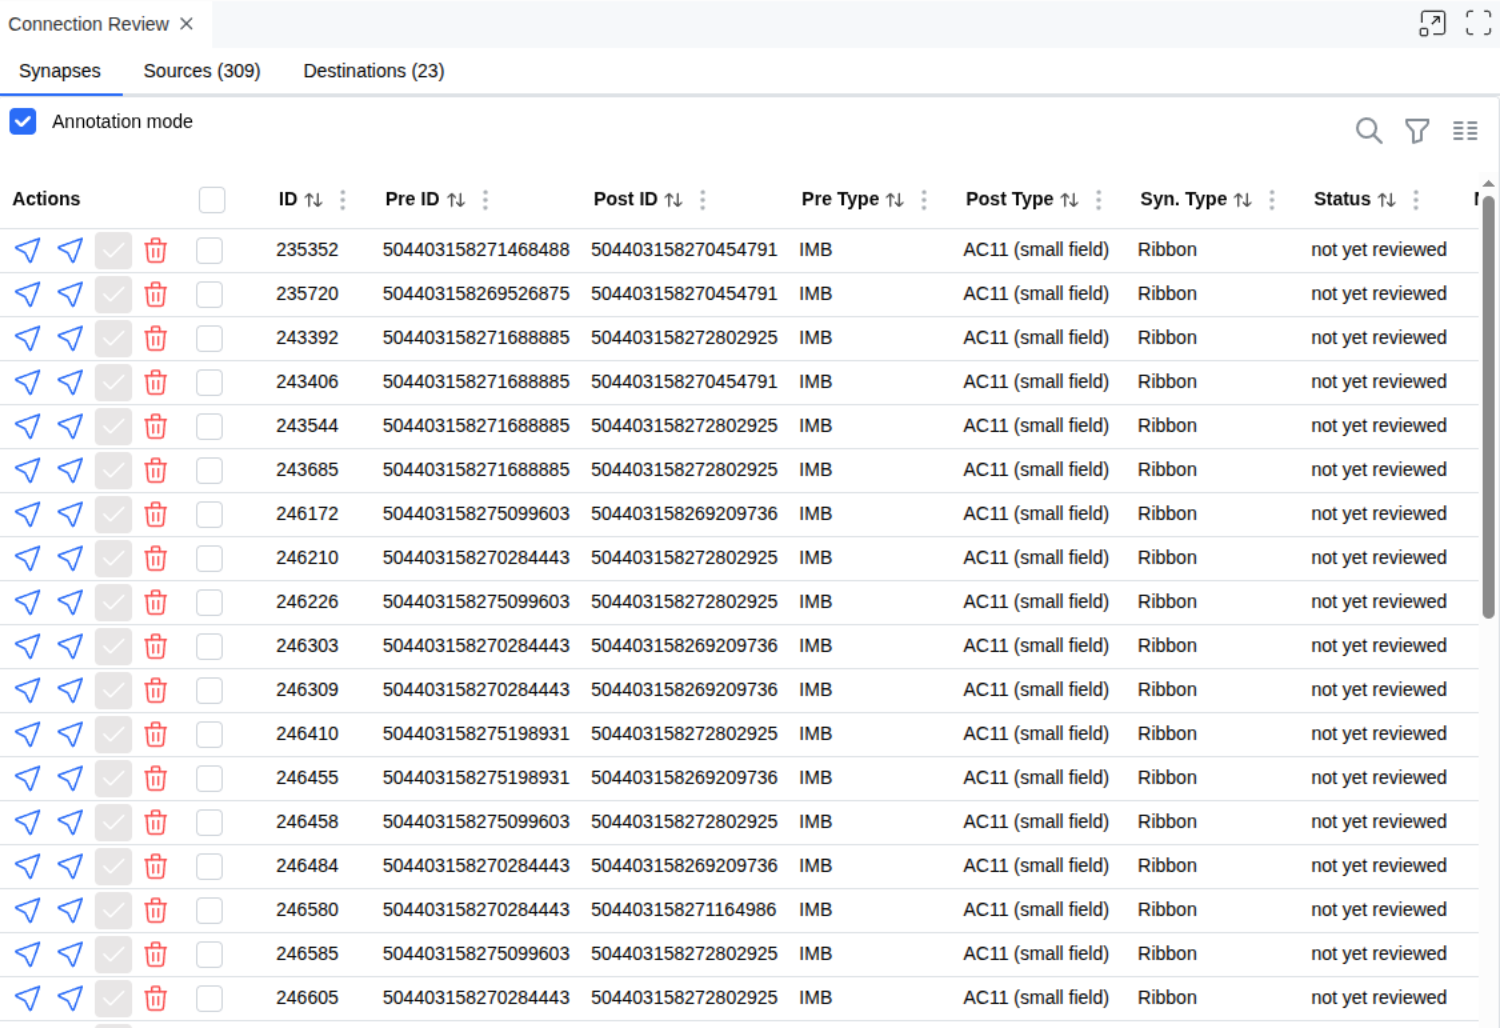
Connection Review
Review and approve/reject synaptic connections between cell sets.
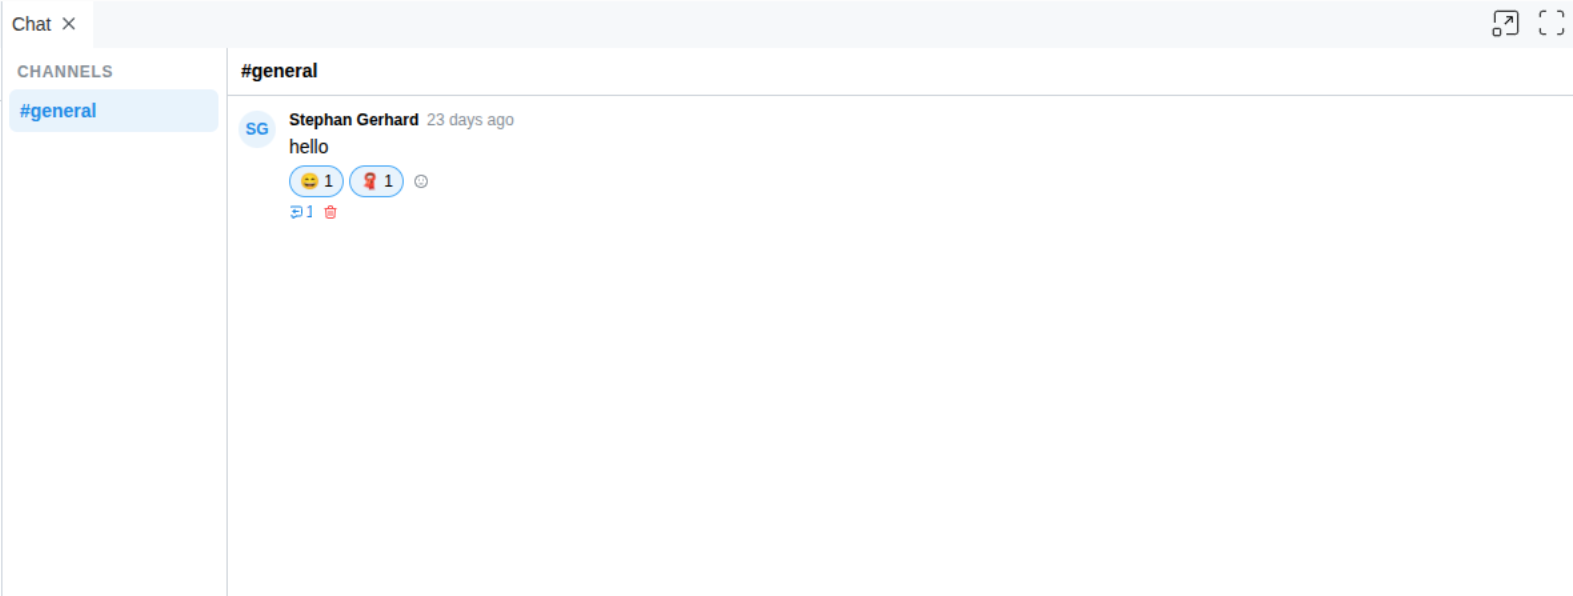
Chat
Real-time chat for discussion and community questions.
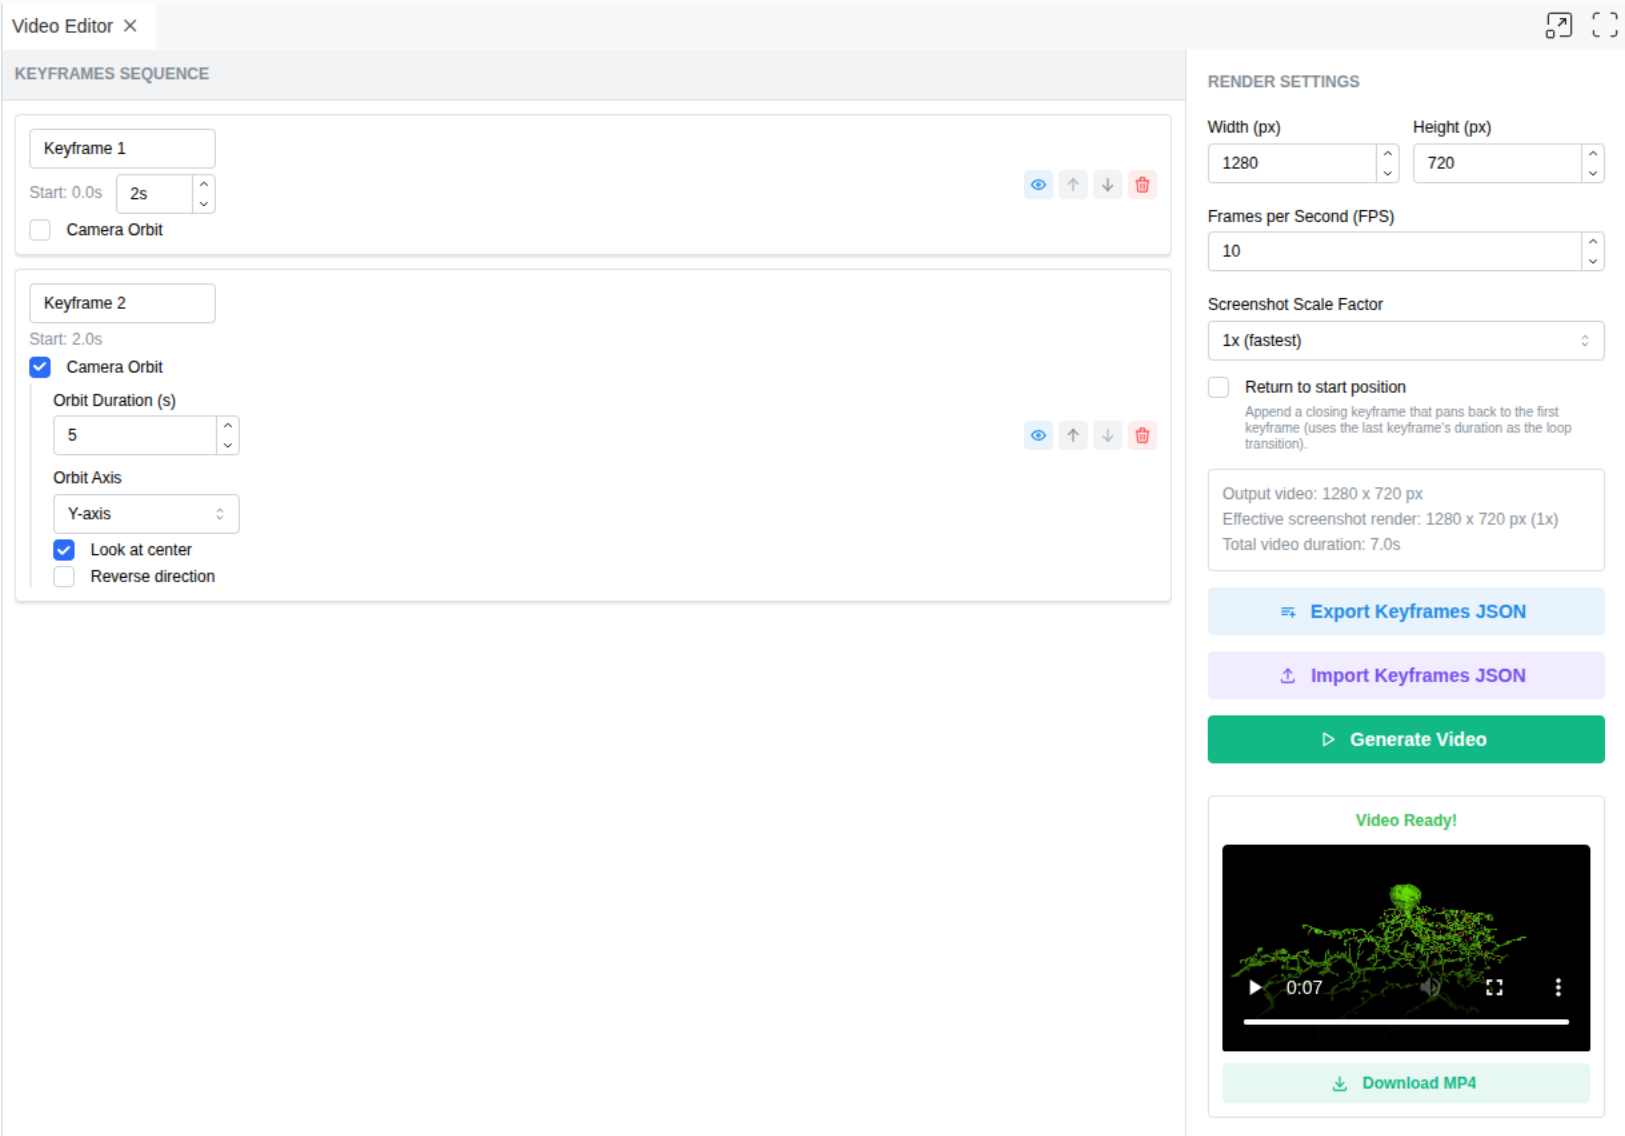
Video Editor
Create and export Neuroglancer keyframe animations as videos.
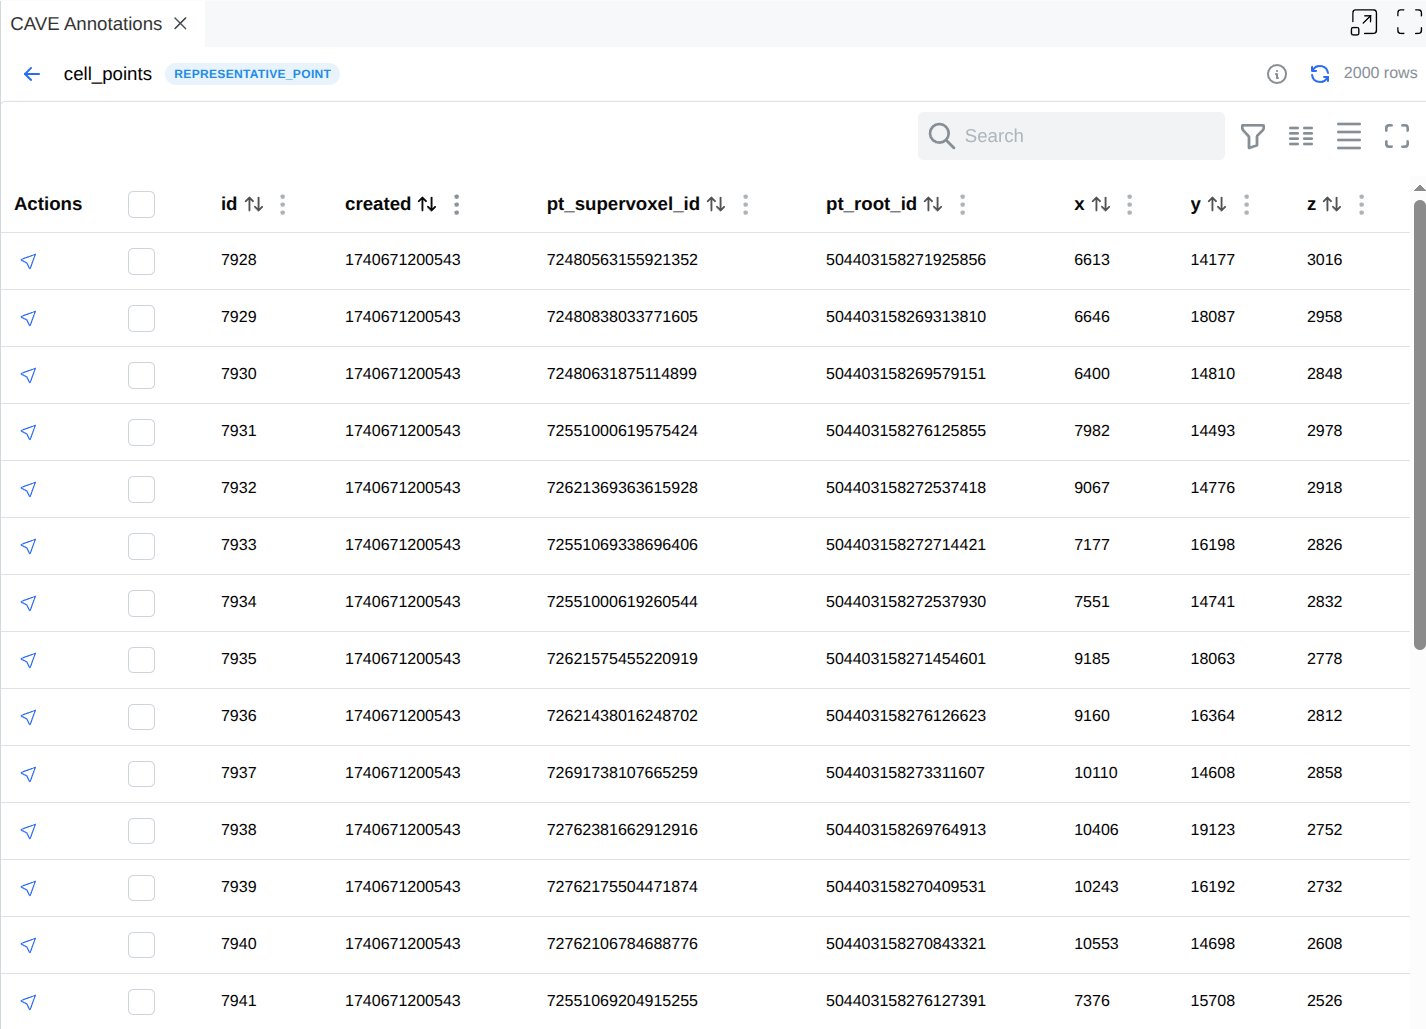
CAVE Annotation Tables
View and edit CAVE annotation tables in a tabular format.